Website analytics
Traffic, sources, pages, goals and search queries in one fast dashboard. Built for WordPress sites that care about clean, reliable numbers.
Visitors
12,480
↑ 8.2%
Pageviews
38,902
↑ 12.5%
Bounce rate
41%
↓ 2.1 pts
Visit duration
2m 14s
↑ 6s
Organic Search
5,210 visitors
Direct
3,480 visitors
Referral
1,920 visitors
Sample data for illustration
What you get
Start with the headline metrics, then drill into any breakdown with a click.
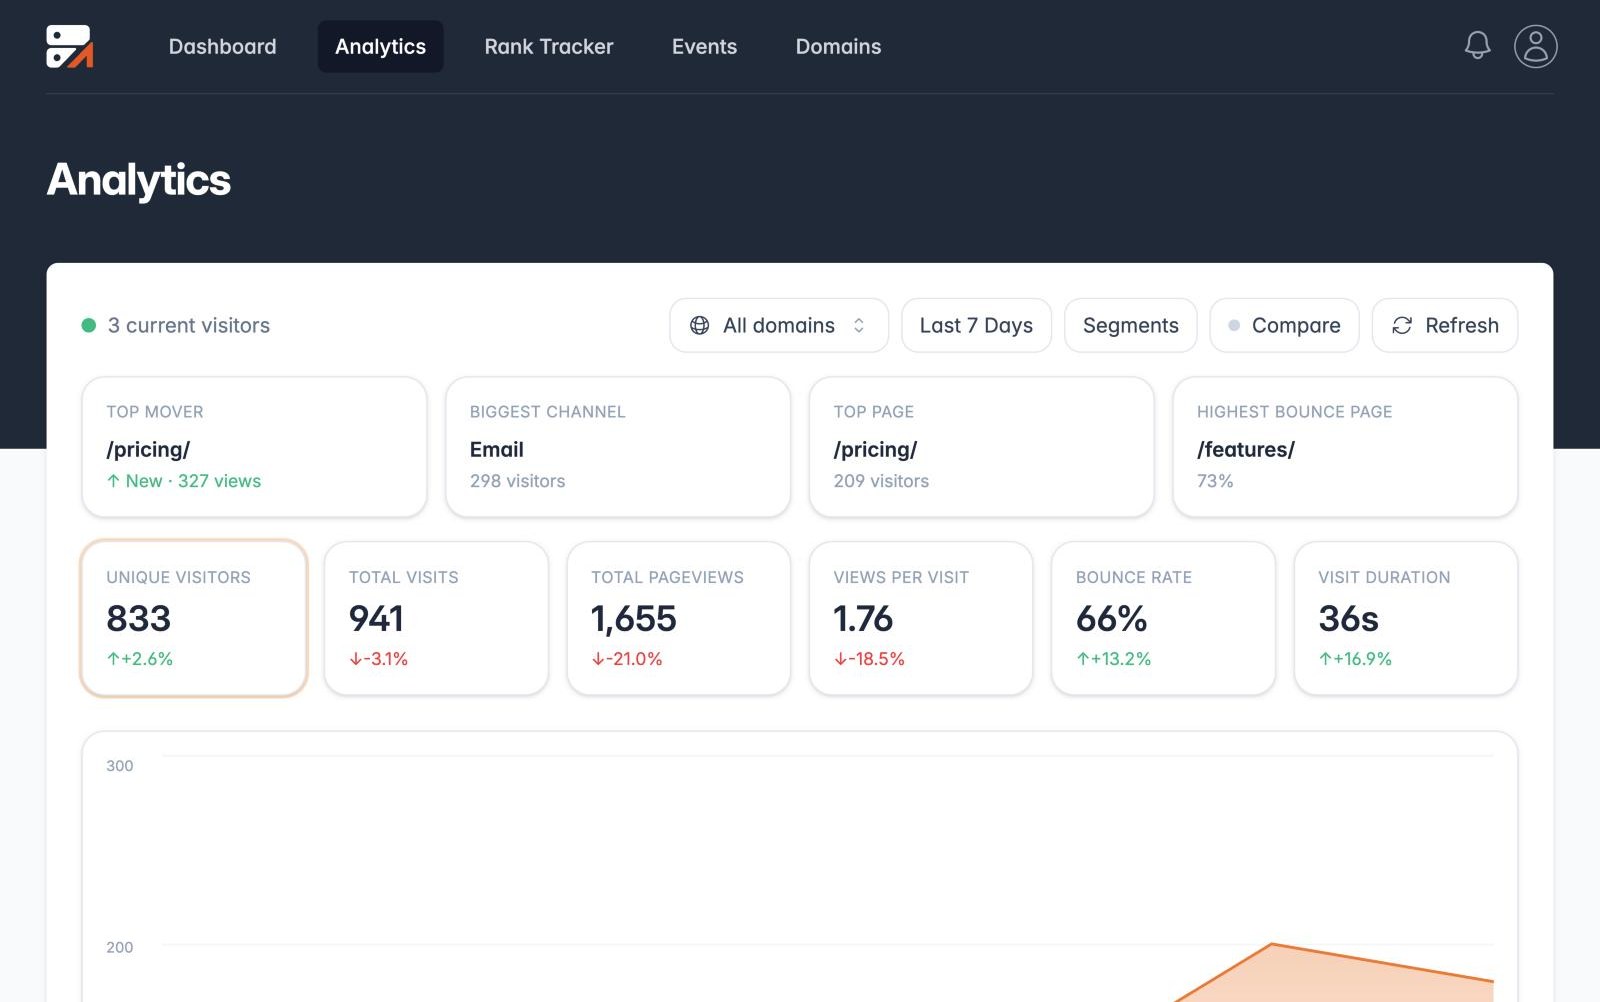
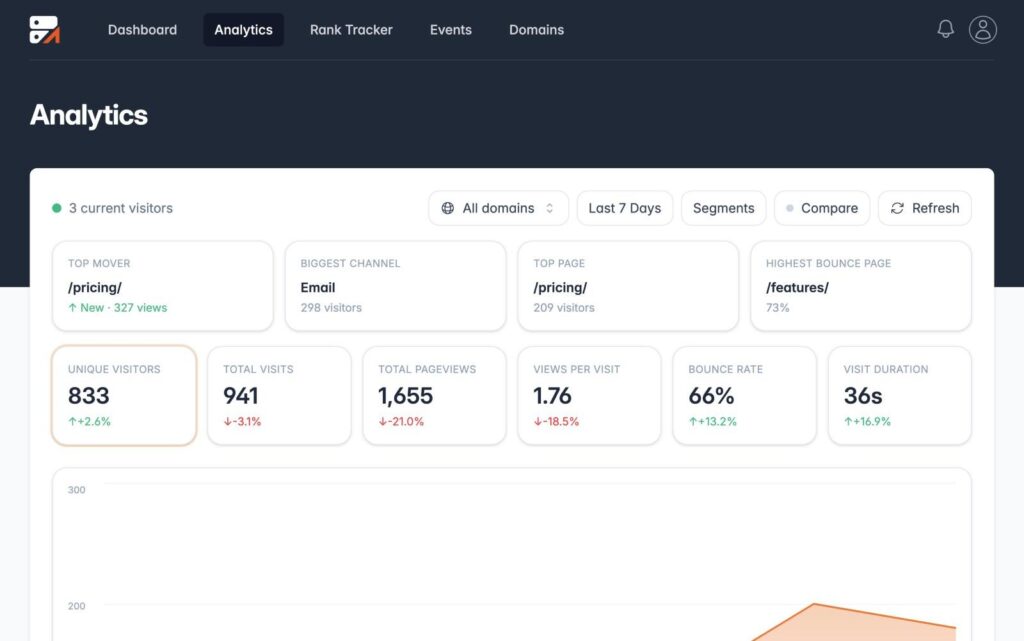
Unique visitors, visits, pageviews, views per visit, bounce rate and visit duration, with a trend chart and insight cards for your biggest channel, top page and top mover.
See current visitors and a live chart as people arrive. Perfect for launches, campaigns and newsletters.
Compare any range to the previous period and see the change on every metric, chart, breakdown row and goal.
Channels, sources and campaigns, with full UTM breakdowns for medium, source, campaign, content and term.
Top pages, entry pages and exit pages with views, bounce rate, time on page and scroll depth.
Countries, regions and cities, plus devices, browsers and operating systems with recognizable icons and flags.
Search insight
Connect Google Search Console or Bing Webmaster Tools and see your real search queries next to your traffic, with opportunities ranked for you.
✓ Clicks and impressions per query
✓ SEO opportunity score, click lift and target CTR
✓ Save filters as reusable segments
✓ Click any row to filter the whole dashboard
Analytics in action
A closer look at what the dashboard shows you.
Headline metrics
Visitors, visits, pageviews, views per visit, bounce rate and visit duration, with a trend chart. Watch current visitors arrive in realtime during a launch or a newsletter send.
Illustrative data
Compare periods
Compare any date range to the previous period and see the change on every metric, chart and breakdown row.
Sources and campaigns
Channels, sources and campaigns, with full UTM breakdowns for medium, source, campaign, content and term.

Channels and UTM
Start with channels, then open a source to see which campaign and medium sent the traffic. Click any row to filter the whole dashboard.
Campaigns (UTM)
Illustrative data
Location and tech
Countries, regions and cities, plus devices, browsers and operating systems, all filterable and saved as segments.
Browsers and systems
Illustrative data
Search insight
See clicks and impressions per query, with an SEO opportunity score, click lift and target CTR. Save filters as reusable segments.
Illustrative data
Reports
Send email reports for every domain, and invite colleagues or clients as Read-only, Edit or Owner. Every plan includes unlimited domains.
yourdomain.com · last 7 days
Illustrative data
At a glance
2,000
free tracked events every month
Unlimited
domains on every plan
3 / 24
months of retention, free / paid
$12
per month, paid plans start here
Realtime
view of current visitors
Inside the app
Anonymized screenshots from the app.
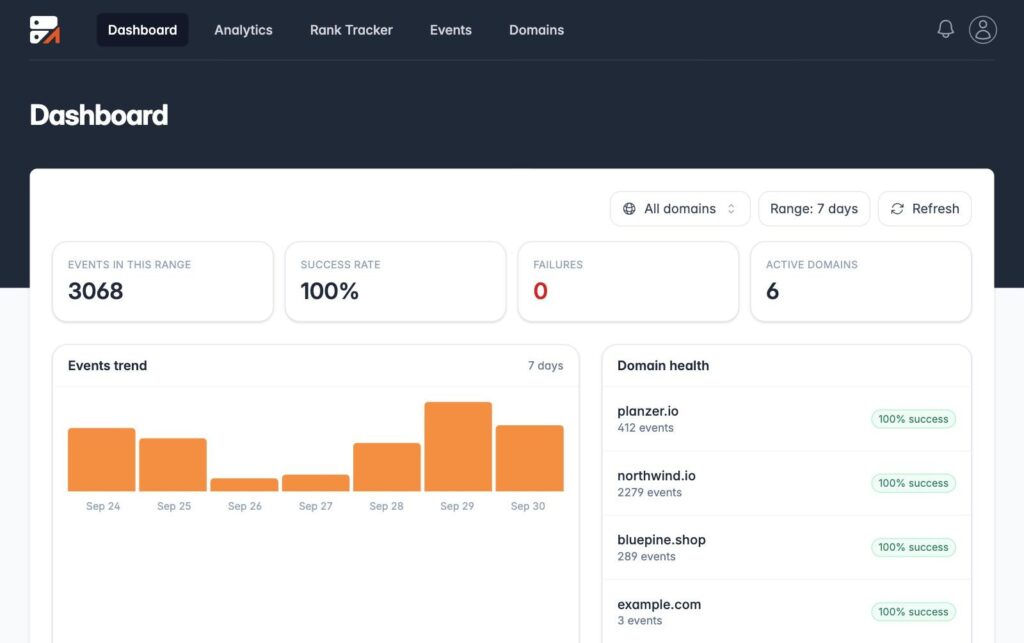
The dashboard: visitors and events at a glance.
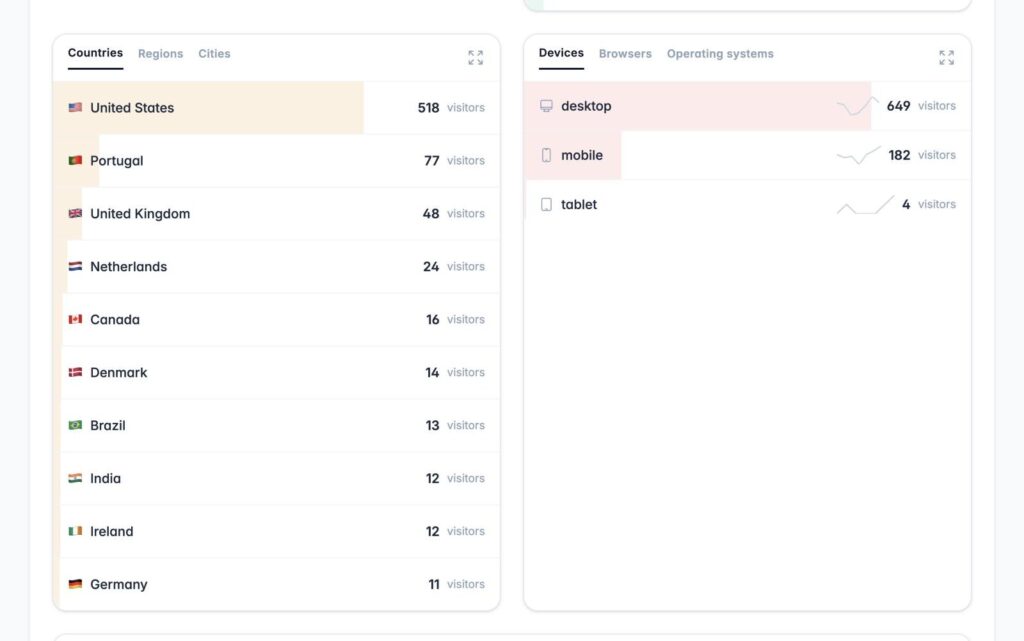
Countries, regions and cities.

Every domain in one account.
Add the WordPress plugin, paste your API key and your first data shows up in minutes.
